
Tableau Tales Unleashed
Welcome to the whimsical world of Tableau where data storytelling meets visual enchantment! Unleash your imagination with my tableau projects, each a kaleidoscope of interactive visuals, vibrant charts, and magical insights. Dive into the depths of data analysis with a sprinkle of creativity that adds a fun factor to every project. Embark on a journey of discovery as data comes to life, revealing patterns and trends in an artistic display. Whether you’re an eager employer seeking data sorcery or a freelancer ready to collaborate on new adventures, join me in this tableau wonderland for a thrilling data-driven escapade.

D
ata Modeling
Robust data relationships and structuring.
Interactive Dashboards
Engaging visualizations for data exploration.
Actionable Insights
Empowering data-driven decision-making.
Data Cleaning
Ensuring accurate and reliable data
Advanced Analytic
Powerful insights through advanced calculations.
Custom Visualizations
Tailored visuals for impactful storytelling.
Interactive Reports
Intuitive and dynamic data exploration.
Data Prep Excellence
Efficient data preparation for analysis.
Data Scientist Job Salaries
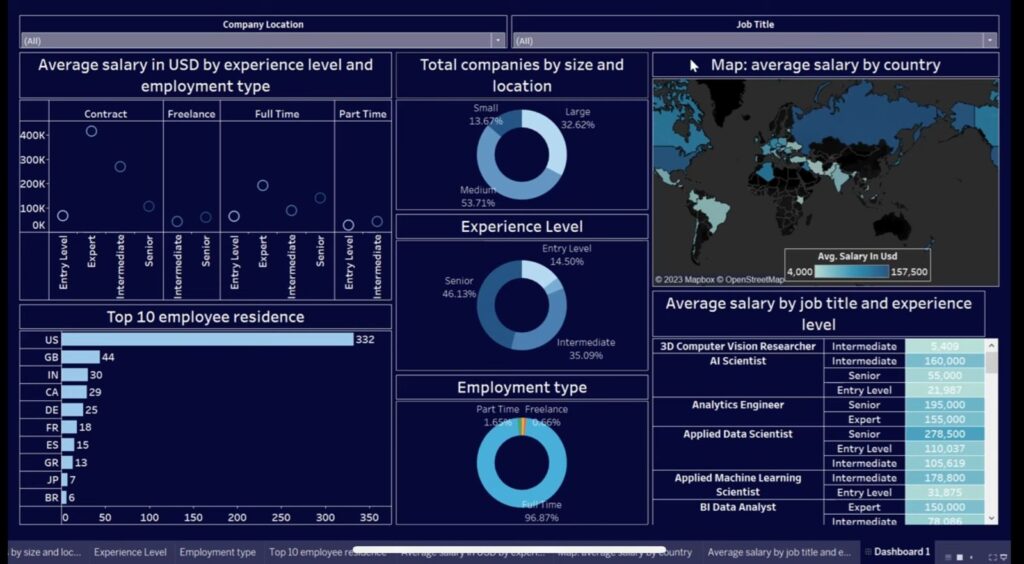
Explore the dynamic world of data science job salaries through my Tableau project. This advanced-level dashboard showcases average salaries in USD based on experience level, employment type, and job title. Discover the top 10 employee residences and gain insights into total companies categorized by size and location. The interactive map highlights average salaries by country. Immerse yourself in the realm of data-driven decisions as I illustrate how to create this comprehensive dashboard, empowering you to navigate the complexities of data science salaries with ease.
Netflix Movie Insights
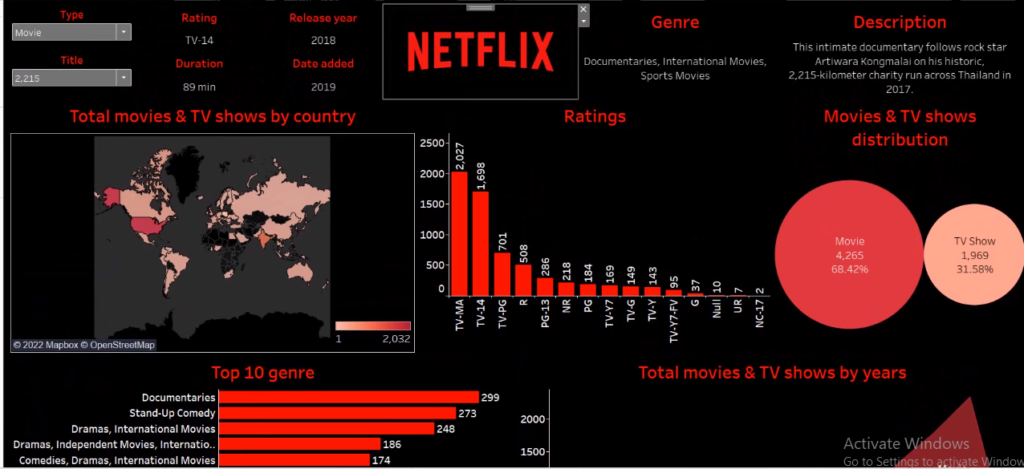
- Immerse yourself in the world of movies with this professional-grade Tableau dashboard showcasing data visualization mastery. Delve into a comprehensive range of movie-related data, including genre, release year, ratings, movie types, titles, duration, and descriptions. Engaging bar charts, heat maps, and area plots bring the data to life, offering intuitive exploration and valuable insights. Filter by genre and release year, and explore the top 10 genres for a captivating movie experience. With a user-friendly design and captivating visuals, this dashboard highlights the art of storytelling through data analysis.
BM HR Insights
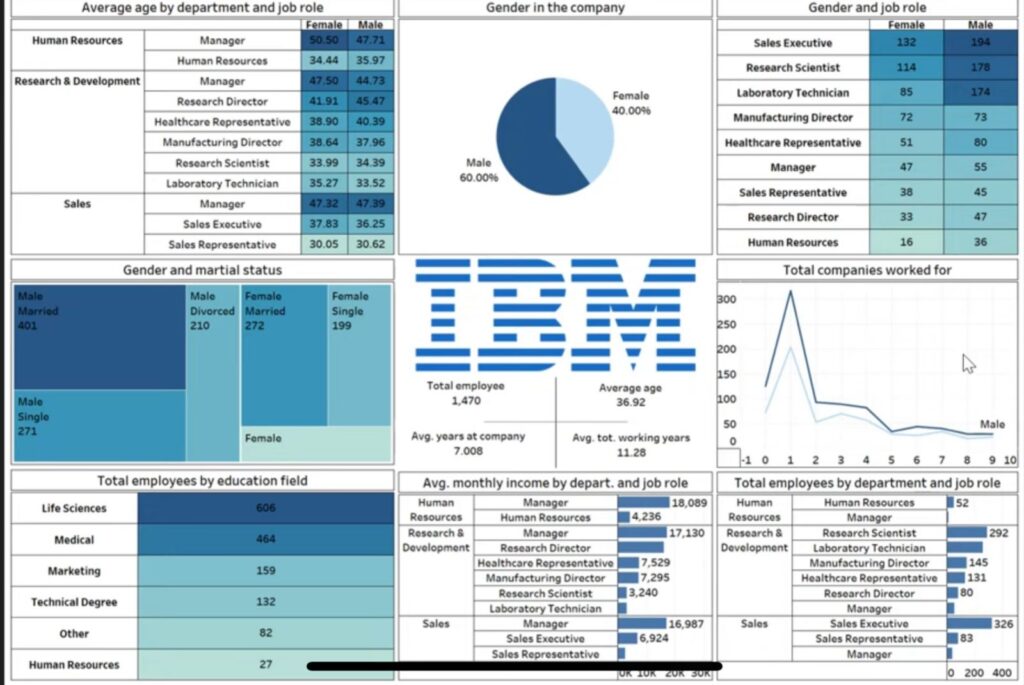
Delve into the world of HR analytics with this comprehensive Tableau dashboard focused on IBM’s HR department. Uncover valuable insights into gender and marital status distribution, average age by job roles and departments, employee education fields, and monthly income breakdowns. Visualizations are thoughtfully crafted using advanced Tableau features to present complex data in a user-friendly and engaging manner. This project empowers HR professionals at IBM to make data-driven decisions, fostering growth and innovation within the company. Explore the art of data visualization as I showcase the power of analytics in the HR realm.
IMDb Top 1000 Analysis
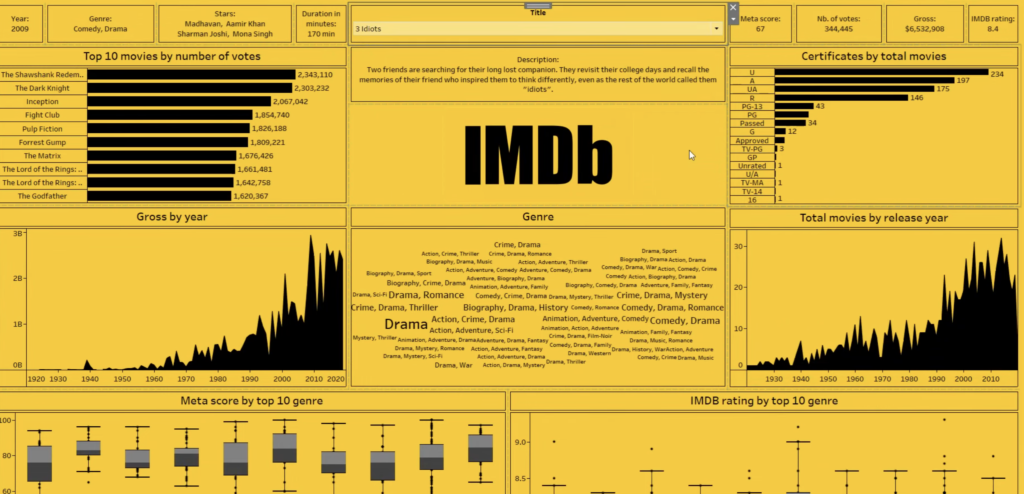
Experience the magic of IMDb’s top 1000 movies through this captivating Tableau dashboard. With an array of dynamic charts, compare and contrast the top 10 movies based on stars, release year, genre, and gross business. Effortlessly apply movie filters to unlock a world of data-driven movie details. Uncover intriguing trends as you explore the total number of movies released each year. This advanced-level project harnesses the power of data visualization to present a compelling cinematic journey. Immerse yourself in the world of movies as I showcase the art of data storytelling through IMDb’s finest.
Let's Work Together
Ready to collaborate on data-driven projects? I’m eager to bring my expertise in Power BI, Tableau, SQL, Python and data analysis to your team. Let’s turn insights into action and create impactful solutions together. Contact me to explore exciting opportunities