

Data-driven Insights with Power BI
Unleash the power of data with my expertly crafted Power BI page. Harnessing the capabilities of Power BI and Power Query, I ensure clean, accurate, and comprehensive data. Through meticulous data cleaning, transforming, and modeling, I deliver actionable insights. Seamlessly visualizing complex information, I create dynamic reports and interactive dashboards. With a keen eye for detail, I design user-friendly interfaces and implement advanced features like drill-through and custom slicers. As a testament to my expertise, this page showcases my proficiency in data storytelling, empowering businesses to make data-driven decisions.
Interactive Dashboards
Dynamic data visualization for insights.
Data Modeling
Efficient data relationships and hierarchies.
Actionable Insights
Empowering data-driven decision-making.
Data Cleaning
Ensuring accurate and reliable data
Advanced Analytic
Deeper insights with advanced calculations.
Custom Visualizations
Tailored visuals for impactful reports.
Interactive Reports
User-friendly and engaging data exploration.
Power Query Magic
Efficient data transformation and preparation.
Modern UX/UI Designed Power BI Desktop Report
Explore this advanced-level Power BI dashboard showcasing Microsoft Power BI’s versatile capabilities. Created with precision using PowerPoint alignment and resizing tools, it features layered grouping, interactive bookmarks, and slicer integration for seamless navigation. Drillthrough and tooltip pages offer in-depth insights. Customized visualizations, themed design, and animated icons enhance data presentation. The web-app-inspired layout with headers and footers ensures a user-friendly experience. Discover the art of data storytelling with this sales and profits analysis dashboard, demonstrating mastery in Power BI techniques.

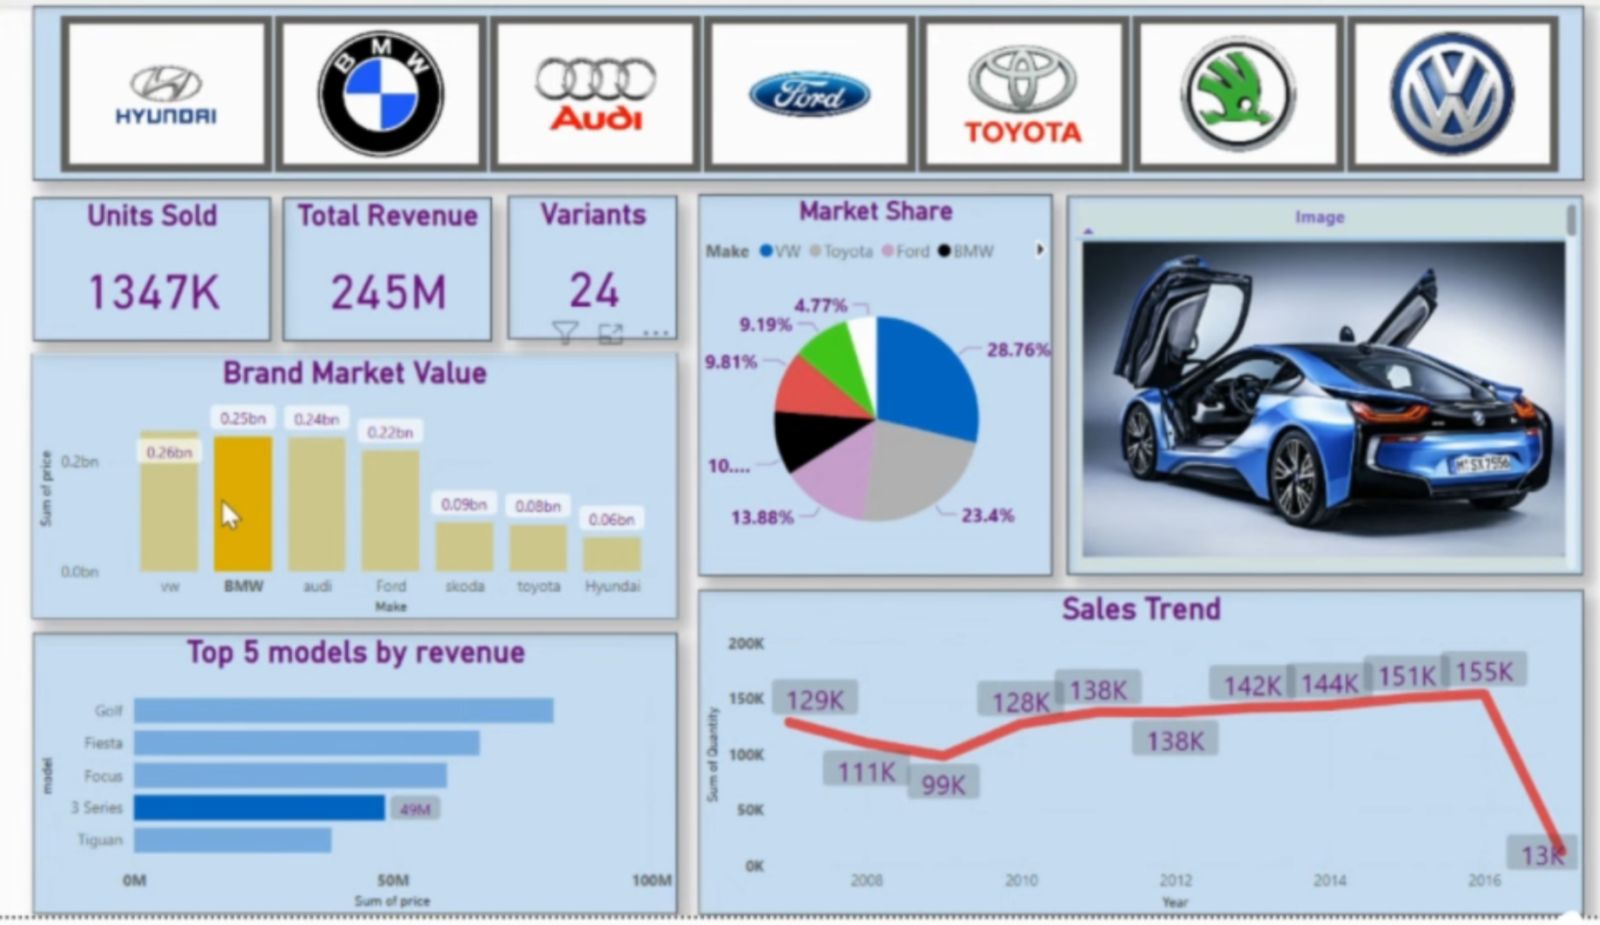
Norway Car Sales Dashboard
Immerse in data analysis with my captivating Power BI project on car sales in Norway. Uncover key insights with interactive visualizations, showcasing units sold, total revenue, and market share. Witness advanced techniques in data import, visualization creation, and dynamic filtering using Power BI. As a data-driven explorer, I demonstrate expertise in transforming raw data into actionable business intelligence. The innovative car image change based on company filters adds a touch of creativity to this project. Embark on a journey of data-driven discovery, mastering the art of visual storytelling with Norway’s car sales data.
Superstore Sales Mastery
Uncover valuable insights as I showcase proficiency in data source connection, transformation, and cleansing. Visualize sales by categories, subcategories, ship modes, regions, and segments, along with profits analysis. This advanced dashboard demonstrates expertise in creating visually appealing visualizations with slicers, filters, and drill-through actions. Empower your data exploration with seamless navigation and effortless exploration of your Superstore sales data. Witness the art of data storytelling and analysis in action, setting the stage for data-driven decisions in your organization.

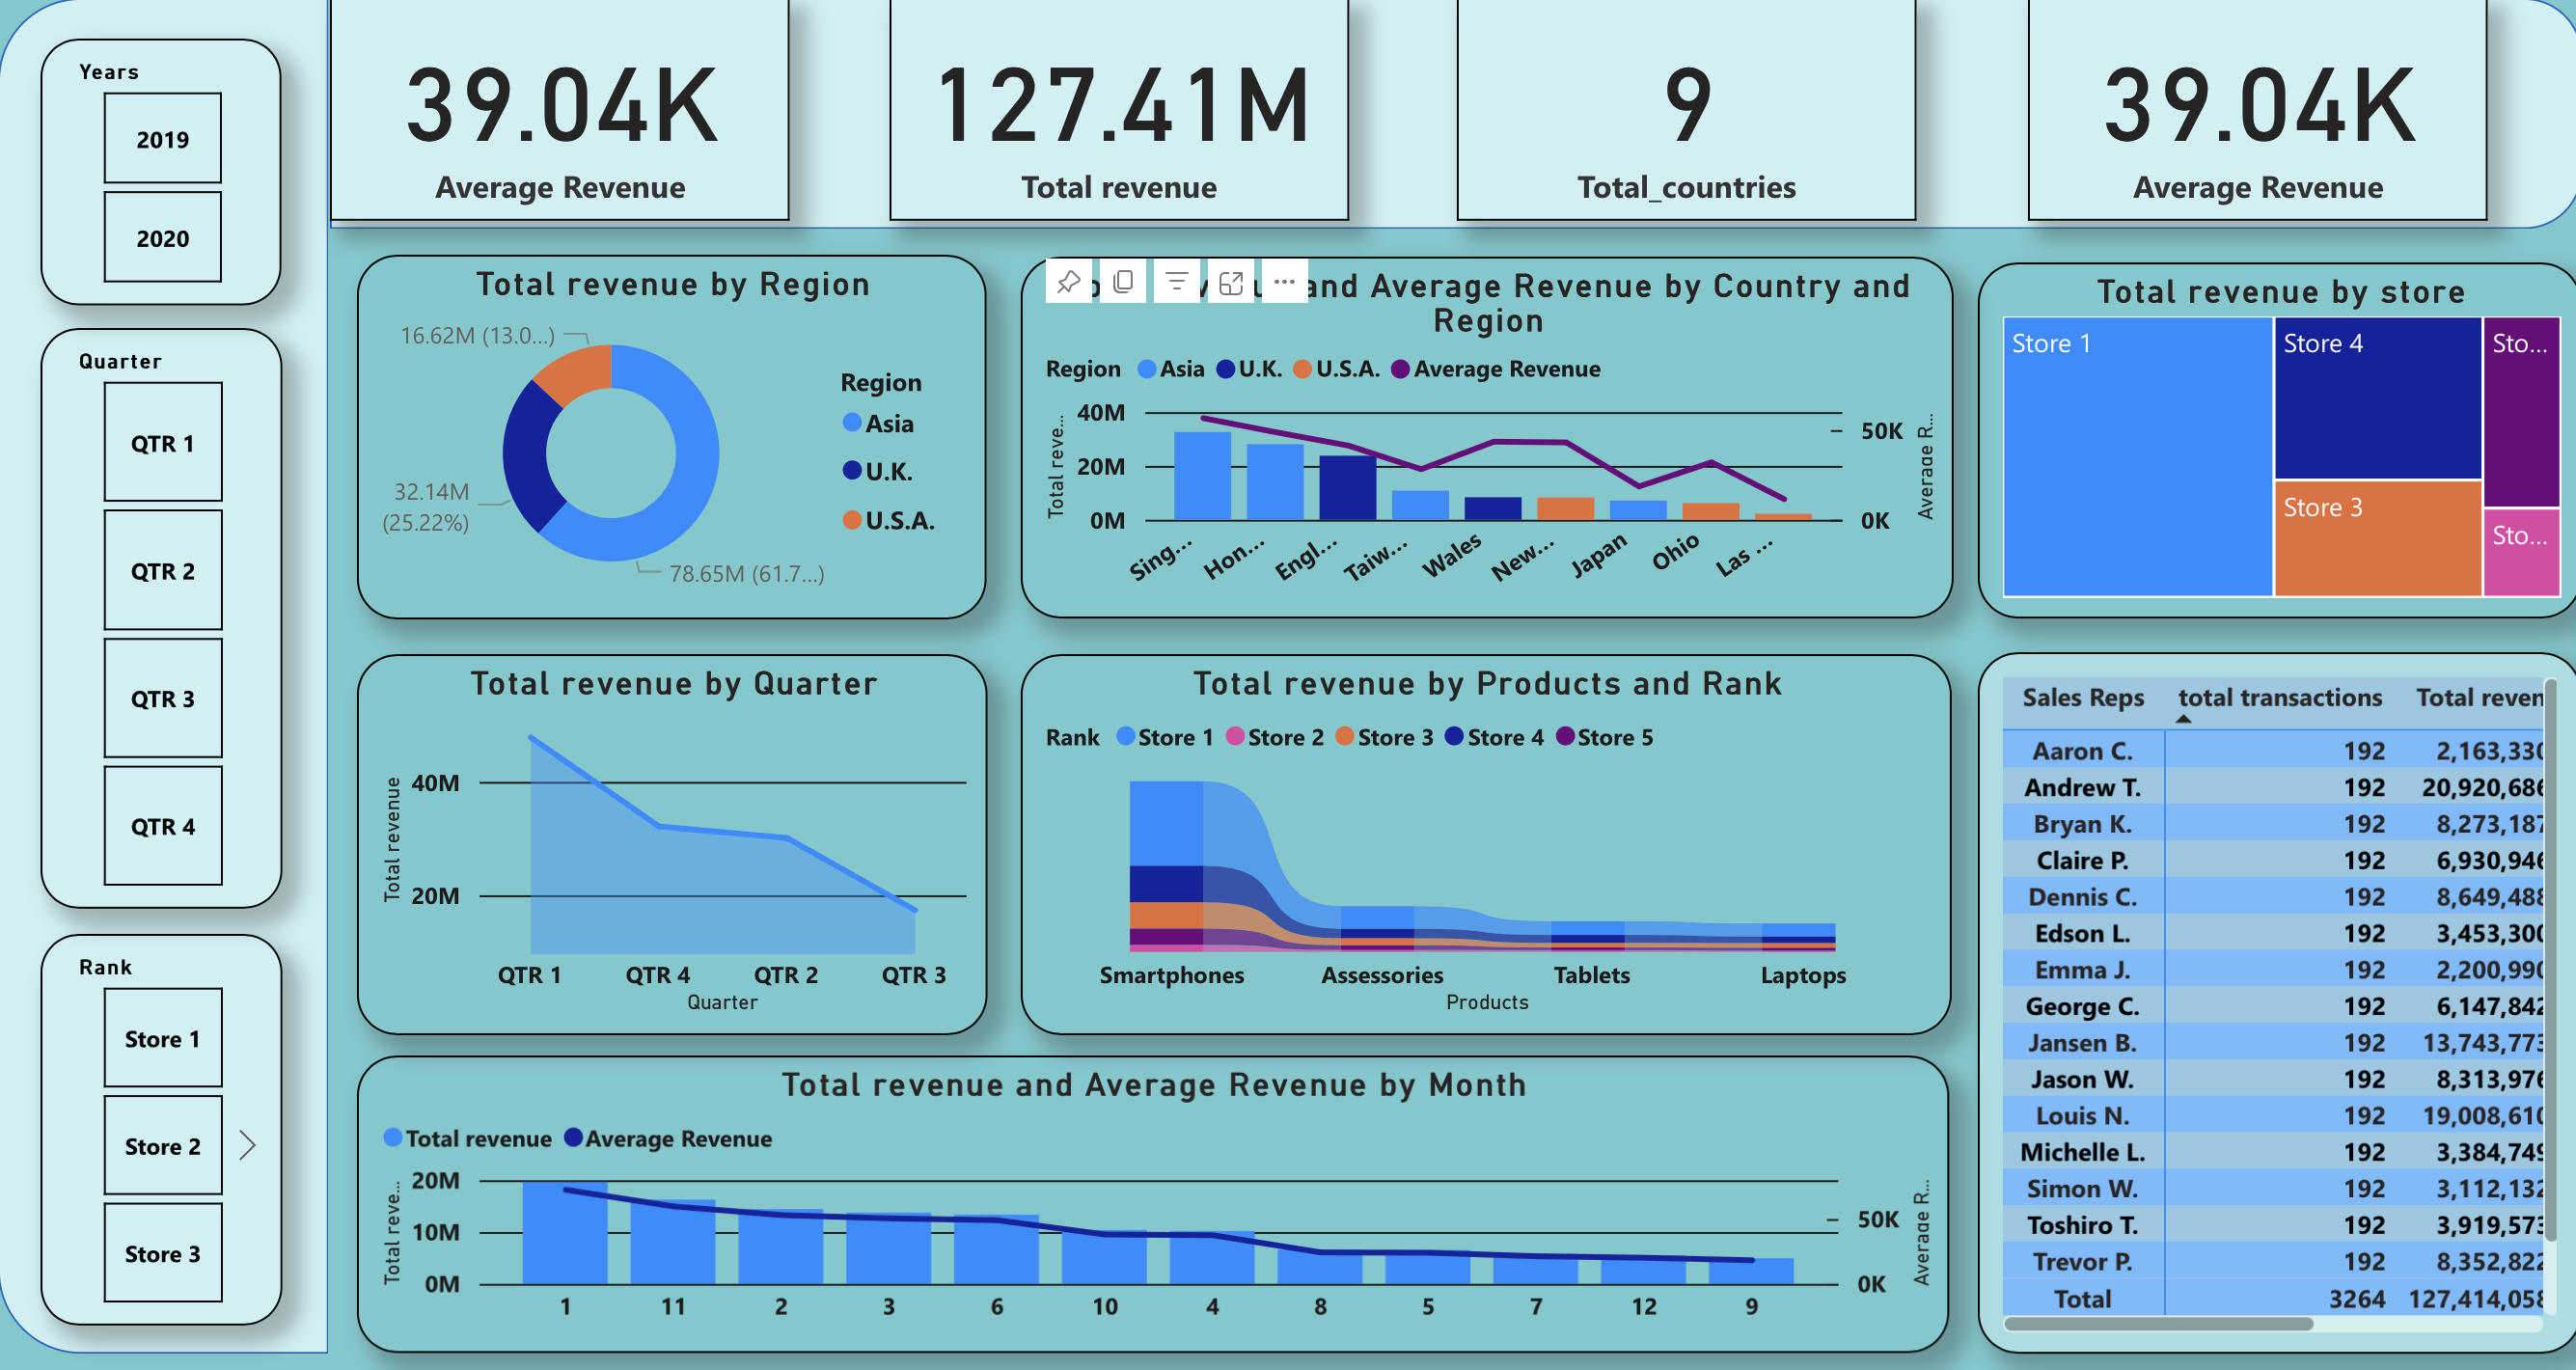
Financial Insights Power BI
Unleash the power of financial data analysis with my advanced Power BI project. From crafting a clear goal to designing compelling visuals, I showcase expertise in conveying complex financial insights. Interactive elements like slicers and bookmarks empower users to customize their data exploration. Through the integration of card visuals with logos, pie charts, bar and clustered column charts, matrix (table) visuals, and heat maps, I present a comprehensive financial analysis. Polishing off the dashboard design with meticulous formatting, colors, fonts, and annotations, this project exemplifies the art of data storytelling for data-driven decision-making.
Let's Work Together
Ready to collaborate on data-driven projects? I’m eager to bring my expertise in Power BI, Tableau, SQL, Python and data analysis to your team. Let’s turn insights into action and create impactful solutions together. Contact me to explore exciting opportunities